How It Works
How to Interpret
the RegimeForecast Dashboard
RegimeForecast combines ensemble Hidden Markov Models with multi-factor market data to produce regime classifications, probability-weighted signals, and forward-looking forecasts. Here's how to read each panel.
Markets don't move randomly — they cycle through distinct behavioral states. Trends persist, volatility clusters, and risk-off periods tend to follow recognizable patterns. RegimeForecast uses a class of statistical models called Hidden Markov Models (HMMs) to identify which state the market is currently in, how confident the model is, and where it's likely headed over the next 7 days.
You don't need to understand the math to use the output. But if you want to — it's all here.
The Math to Calculate Hidden Markov Models
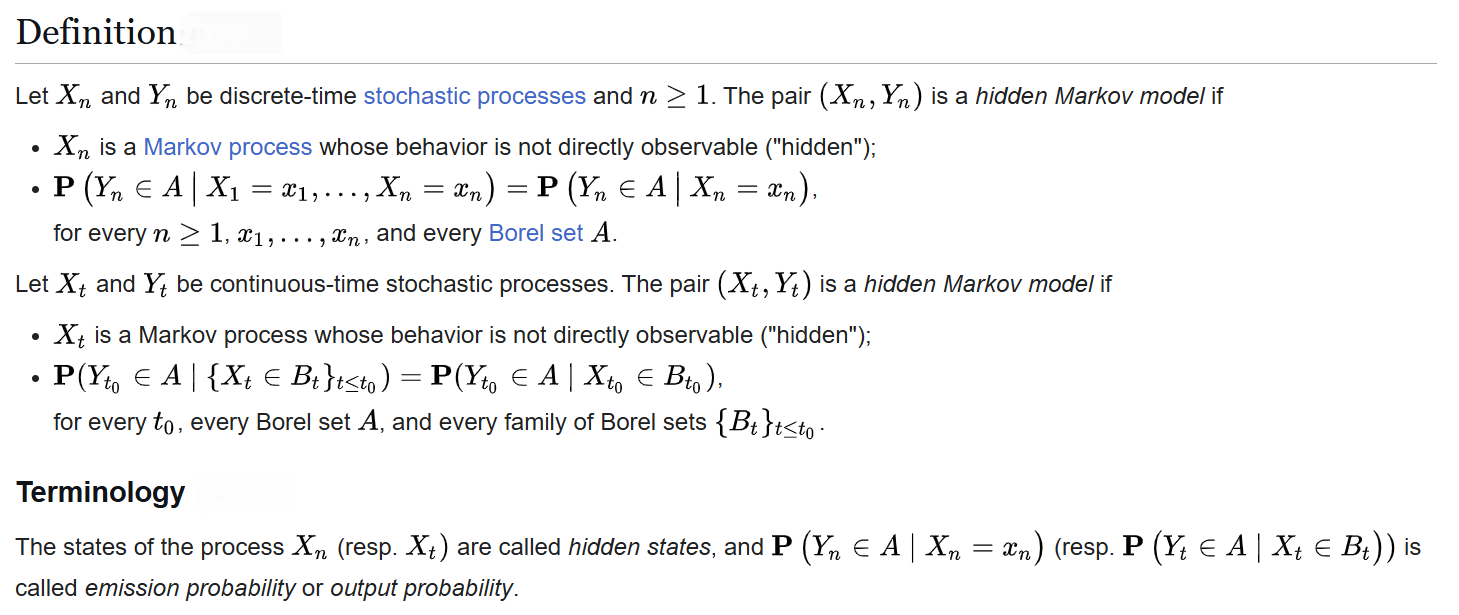
Panel 1
7-Day Regime Forecast
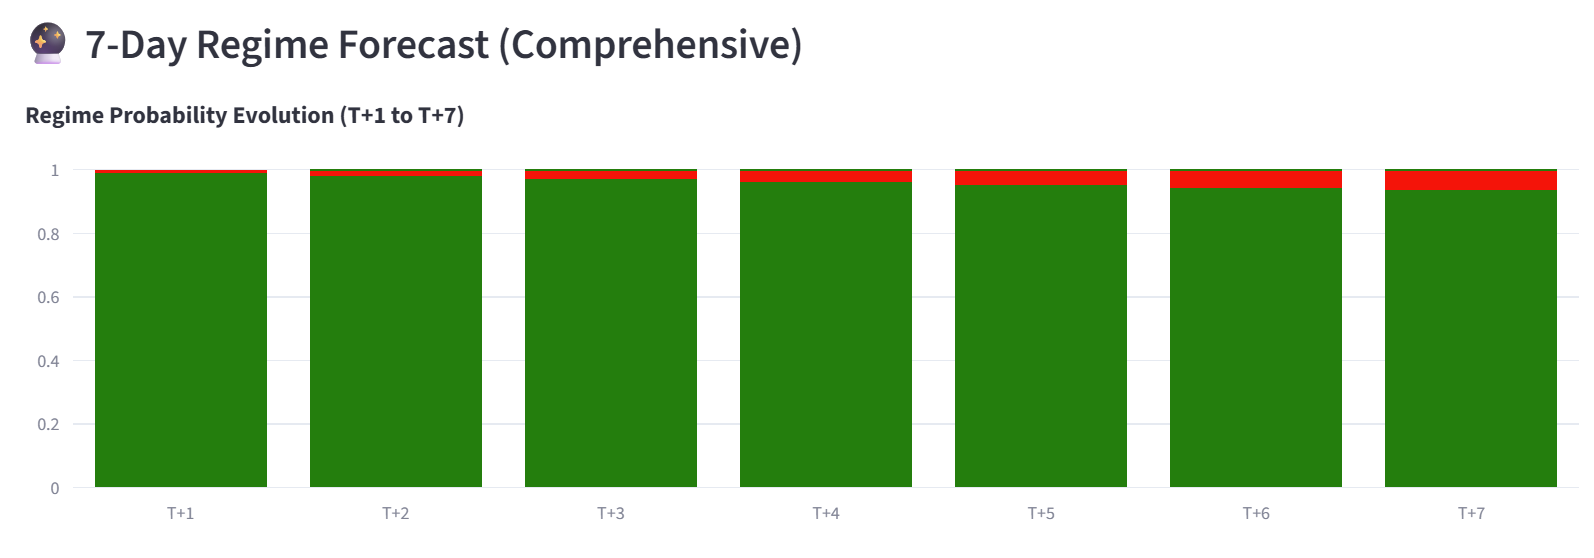
This chart shows the probability distribution of regimes over the next 7 trading days (T+1 to T+7). The stacked bars represent how confident the model is in each regime state.
How to Read It
- Strong green dominance — avoid defensive positioning; the macro backdrop is constructive
- Gradual increase in red — tighten risk controls later in the week
- Sharp red increase — regime transition risk is elevated; volatility hedges become more important
Slightly rising red probability into later days suggests mild uncertainty creeping in — not a regime flip, but a reminder that forecast confidence decays over time.
Panel 2
Asset Signals
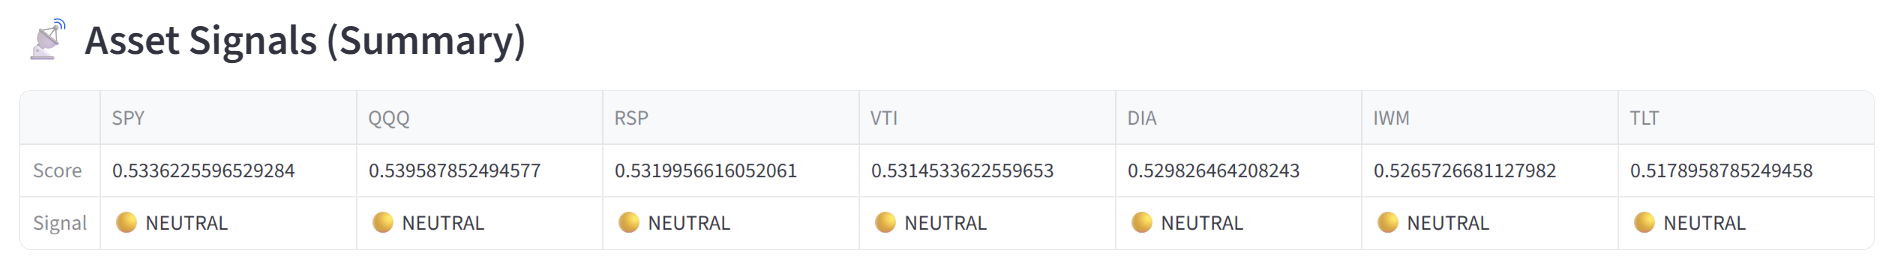
This table translates regime probabilities into asset-level scores. The "Score" represents the probability-weighted expected win rate — similar to Rho-T logic, applied per asset.
Score Thresholds
- > 0.60 — Bullish edge. Consider pressing directional exposure.
- 0.40 – 0.60 — Neutral. No strong statistical edge.
- < 0.40 — Bearish edge. Defensive posture warranted.
When cross-asset dispersion is low (all scores clustered), the macro regime is balanced. This environment often favors carry trades, short-vol strategies, or neutral structures rather than directional bets.
Panel 3
Model Inputs
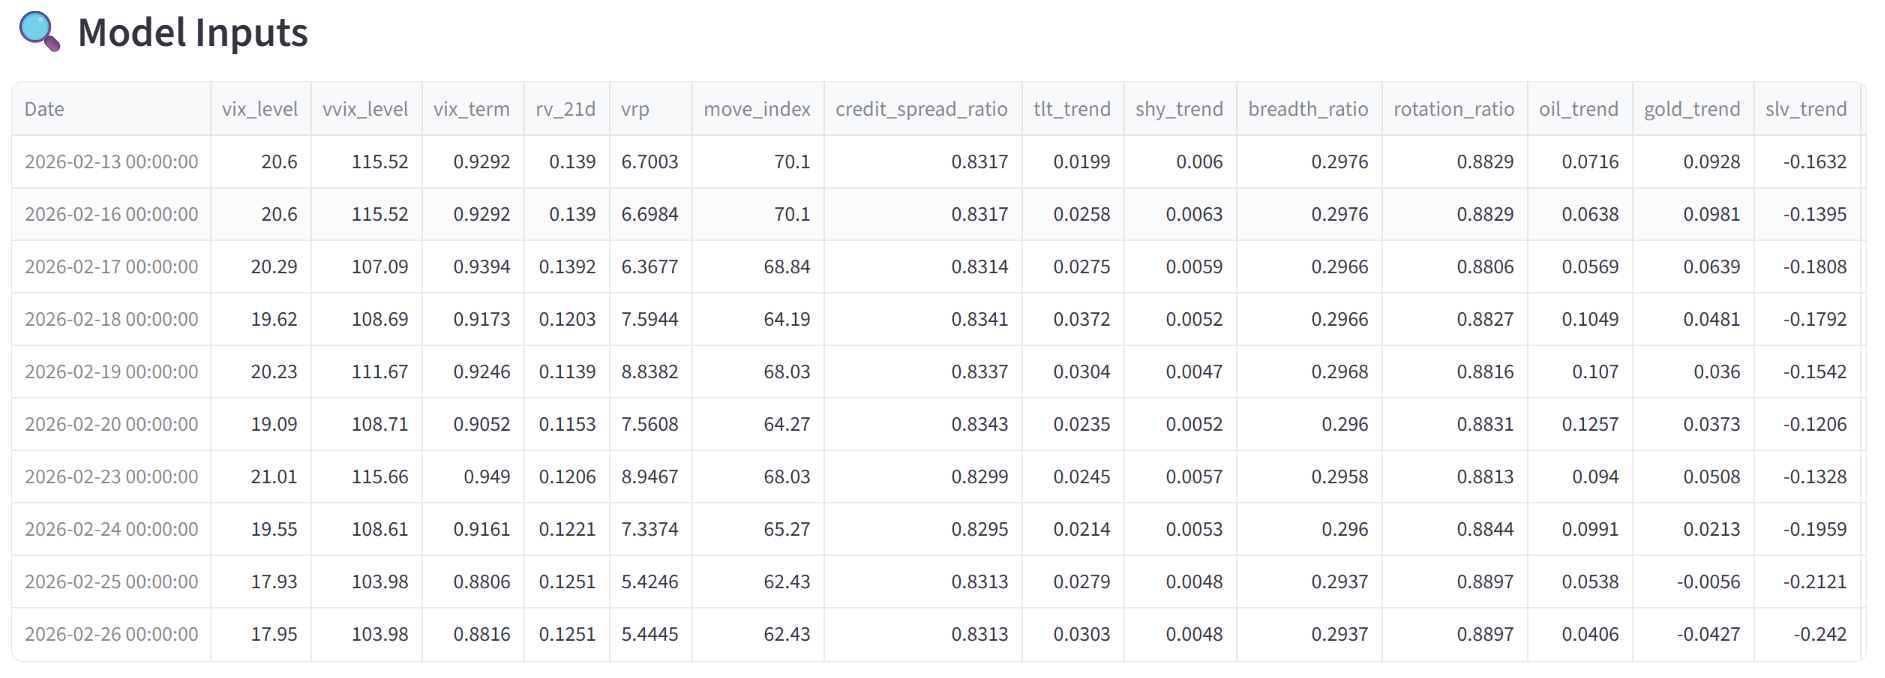
This is your diagnostic dashboard — the raw data driving the model's regime classification. Understanding these inputs helps you see why the model is forecasting what it is.
Key Indicators
- VIX Level & Term Structure — Equity volatility and its forward curve shape
- VRP (Volatility Risk Premium) — Gap between implied and realized vol; higher = options are overpriced
- MOVE Index — Rates/bond market volatility
- Credit Spread Ratio — Credit stress indicator; stable values = no distress
- Breadth & Rotation Ratios — Market participation width and sector leadership rotation
- Commodity Trends — Oil, gold, silver trend signals for macro context
Example Pattern
Falling VIX + declining VRP + stable credit spreads + weak breadth = grind-up price action with compression. This environment is typically short-vol friendly but narrow in leadership.
Panel 4
Rho-T Win Rate
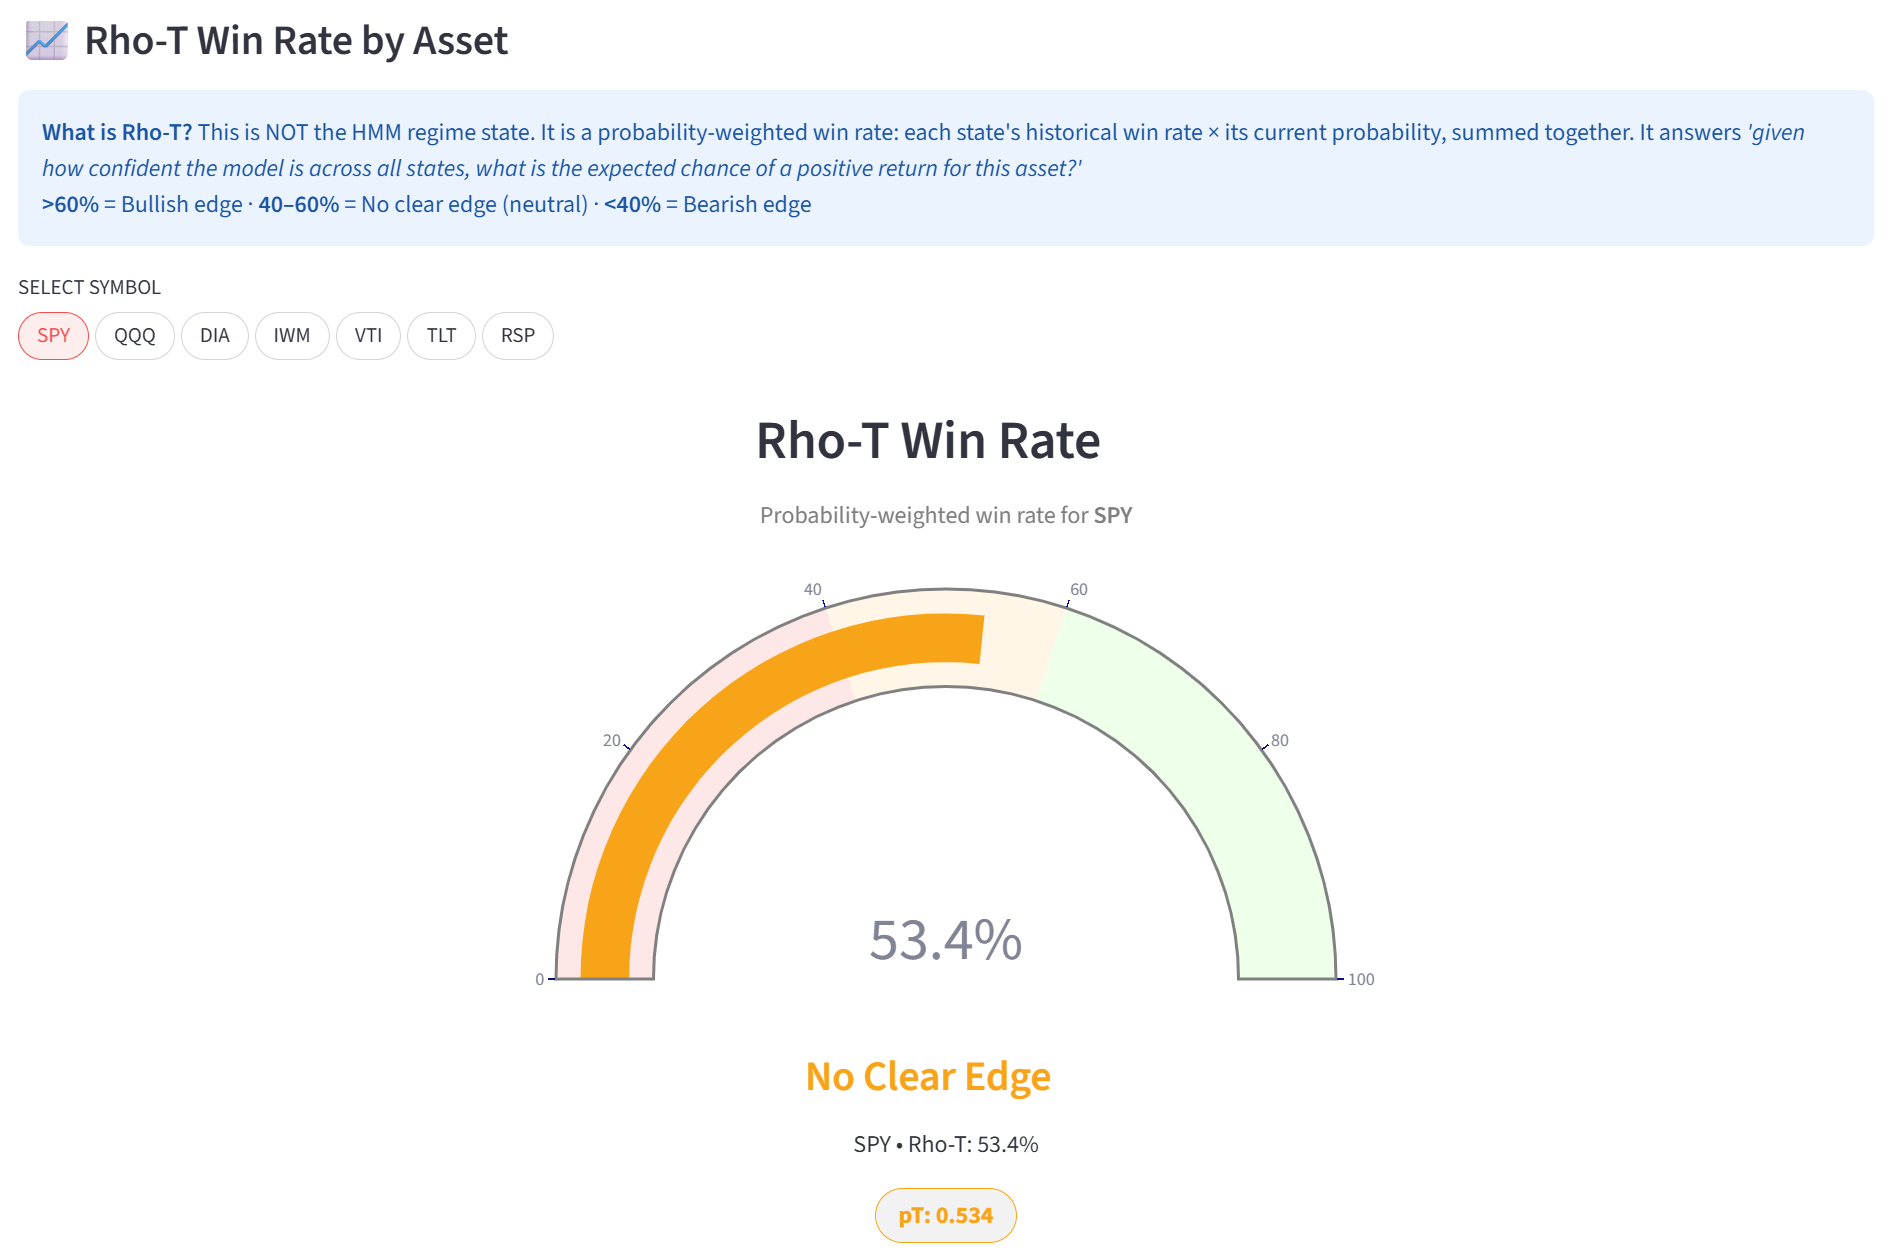
Rho-T is the probability-weighted expected win rate. It is not the regime state — it's the expected win probability given all regime probabilities combined.
How to Think About It
Think of Rho-T as answering: "If I take a long position today, what is my probabilistic edge?"
- > 60% — Bullish edge. Statistical support for directional exposure.
- 40% – 60% — Neutral. No clear regime advantage.
- < 40% — Bearish edge. Risk reduction warranted.
At 53%, the edge is modest. This favors risk-defined structures, short-vol premium harvesting, and avoiding oversized directional bets.
Panel 5
Simple vs Comprehensive Model
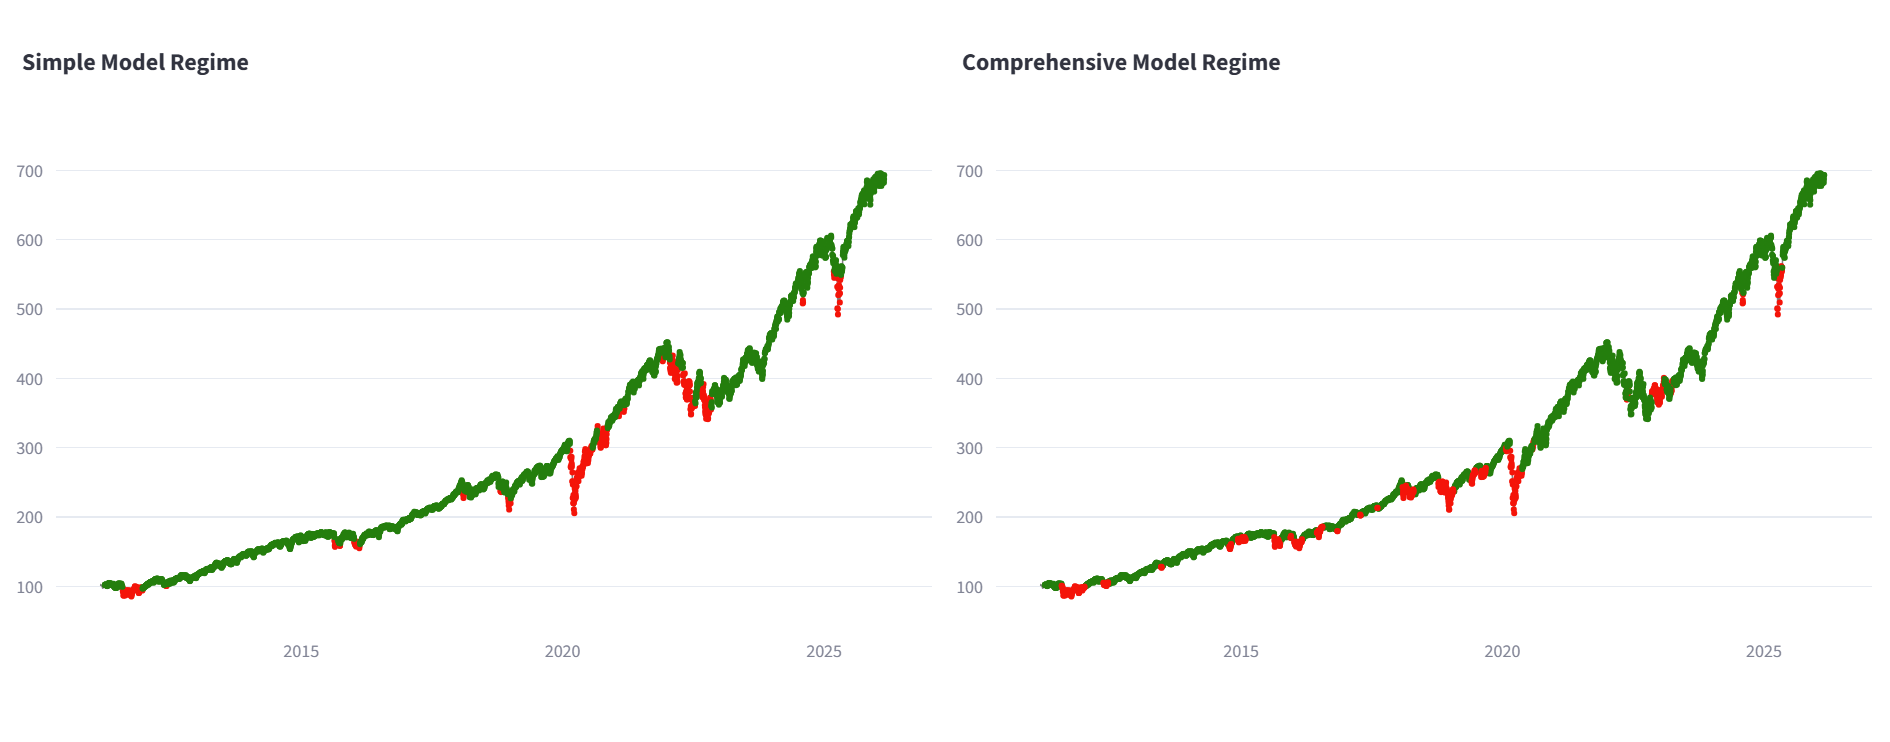
These two charts compare a simpler regime model against the multi-factor comprehensive model. Green dots represent risk-on states; red dots represent risk-off states.
Model Agreement
- Both models agree — High conviction regime classification
- Models diverge — Regime uncertainty; be cautious with sizing
The comprehensive model produces more refined signals, avoids some false flips, and typically reacts faster to macro deterioration. When both models show consistent green in recent periods, it indicates robust macro stability.
Deep Dive
The Quantitative Details
Backtested performance, regime shift detection, out-of-sample validation, and multi-model divergence analysis — the evidence behind the framework.
Result 1
Comprehensive Performance Results vs SPY
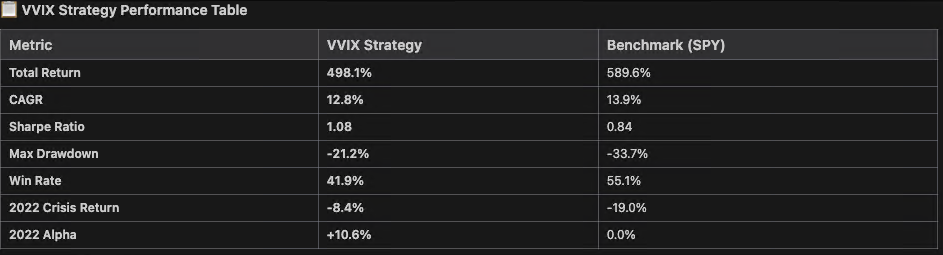
This table compares the VIX Strategy to the SPY benchmark across full-cycle performance metrics. While the strategy underperformed SPY slightly in total return and CAGR, it delivered materially stronger risk-adjusted results.
Key Metrics
- Sharpe Ratio: 1.08 vs 0.84 — significantly higher risk-adjusted returns
- Max Drawdown: -21.2% vs -33.7% — meaningfully lower peak-to-trough loss
- 2022 Crisis Return: -8.4% vs -19.0% — generating +10.6% alpha during the bear market
This is not a pure return-maximization model. It is a risk-managed regime strategy that sacrifices some upside to materially reduce drawdowns and improve risk efficiency. The objective is smoother compounding across cycles.
Result 2
Model Shift Detection (High Volatility Regime)
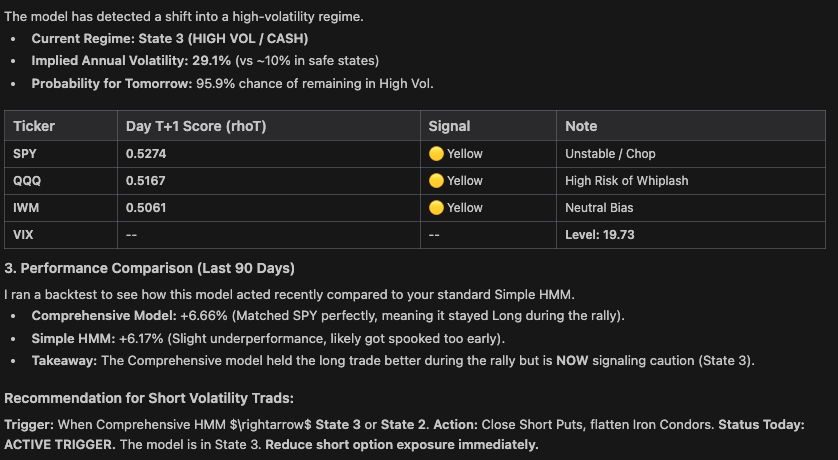
The model identifies shifts into State 3: High Volatility / Cash with high probability. Implied annual volatility of ~29% confirms a statistically unstable environment. RhoT scores remain slightly above 0.50, meaning daily win probability is marginally positive but not high confidence.
Key Insight
- This is not a confirmed crash regime — it is a chop / whiplash environment
- Risk-adjusted returns deteriorate in this state
- For short-volatility strategies, this acts as an active risk trigger
Exposure should be reduced or neutralized until regime stability improves.
Result 3
Performance Report (2024–2026 Test Set)
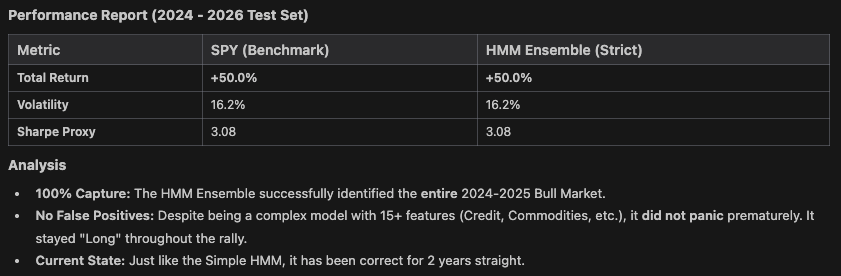
In the 2024–2026 out-of-sample test window, the HMM Ensemble matched SPY's total return (+50%) with identical volatility and Sharpe metrics.
Structural Takeaway
- The model captured the entire 2024–2025 bull market
- It avoided premature exits
- It did not generate false bear signals during the rally
This confirms regime persistence detection works effectively in trending markets. The model does not overreact to noise — a critical flaw in many tactical systems.
Result 4
Calibrated rhoT Scores (Comprehensive HMM)
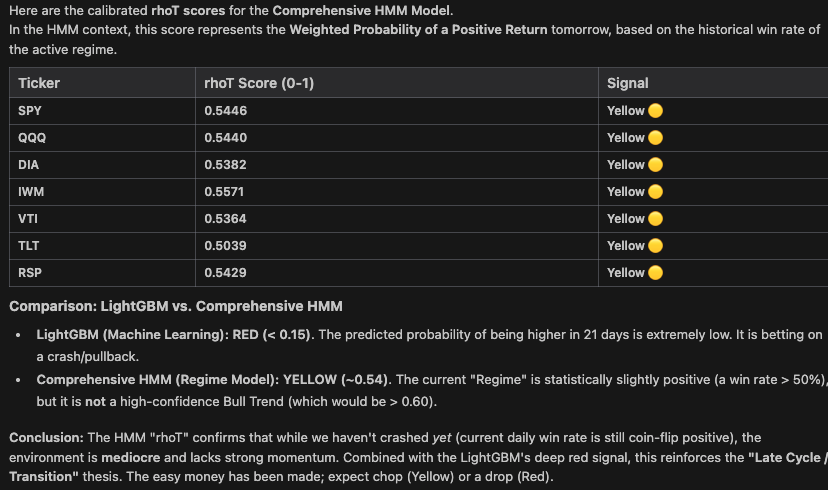
The rhoT score represents the probability-weighted likelihood of a positive return tomorrow based on the historical win rate of the current regime.
Score Interpretation
- 0.50–0.55 — Slightly positive bias, coin-flip territory
- Above 0.60 — High conviction bullish edge
- Below 0.40 — Bearish edge
Scores in the 0.53–0.55 range confirm a statistically coin-flip positive environment — not a strong trend. This supports neutral or risk-defined positioning rather than aggressive directional exposure.
Result 5
HMM Ensemble Model (Advanced Feature Set)
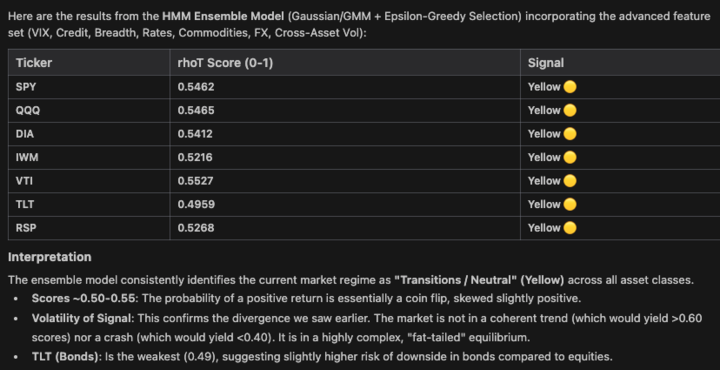
This ensemble incorporates VIX and volatility term structure, credit spreads, breadth and rotation metrics, rates volatility (MOVE), commodities and FX, and cross-asset correlations.
Observation
- Equities slightly positive (~0.54)
- Bonds (TLT ~0.49) show mild downside vulnerability
- Volatility remains elevated
Despite the broader feature set, the model classifies the current regime as "Transition / Neutral" across assets. This is not a clean bull trend, nor a crash — it is a late-cycle equilibrium with elevated fragility.
Result 6
7-Day Market Regime Forecast (Across Models)
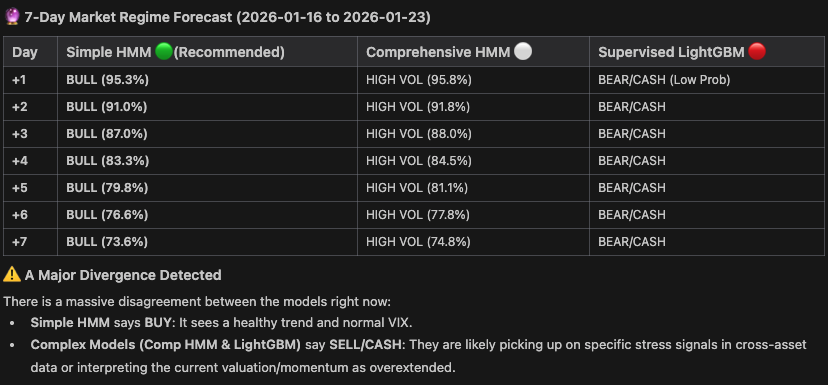
There can be significant divergence between models. When simple trend models remain bullish but macro-sensitive models turn defensive, it often occurs near momentum exhaustion, macro stress build-up, or regime transition points.
Model Divergence Signal
- Simple HMM: Strong Bull probabilities (73–95%)
- Comprehensive HMM: High Volatility regime (75–96%)
- LightGBM: Bearish/Cash bias
This disagreement is critical. Model divergence increases forward volatility expectations and signals elevated regime transition risk.
Result 7
7-Day Outlook Across Models
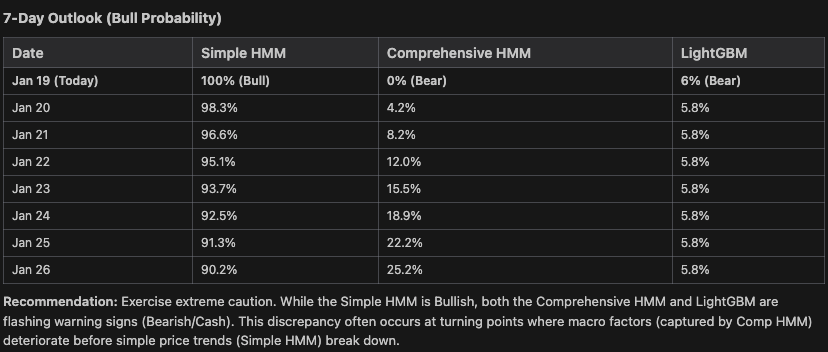
The forward probability table reveals the widening gap between model forecasts — surface trend strength masking underlying macro deterioration.
Divergence Pattern
- Simple HMM: Sustained bull trend (>90%)
- Comprehensive HMM: Rising bear probabilities (0% → 25%)
- LightGBM: Persistent low bullish probability (~6%)
Historically, major regime shifts occur when trend models remain optimistic, macro models turn defensive, and supervised ML signals extreme asymmetry. This is a high-dispersion regime — not a high-conviction bull phase.
See It In Action
Watch the Platform Walkthrough
A quick tour of the dashboard — regime signals, 7-day forecast, asset signals, and the Rho-T indicator.
Ready to see your regime edge?
Start your 14-day free trial and get full access to all five dashboard panels.
Start 14-Day Free TrialNo charge until day 15. Cancel anytime.